Trading Journal for Sierra Chart
Stay in the flow. Your logging is handled.
FlowLogr captures your charts and DOM the instant you execute—automatically, in the background, without breaking your focus.
Native. Fast. Local only.
Public beta coming Q1 2026.
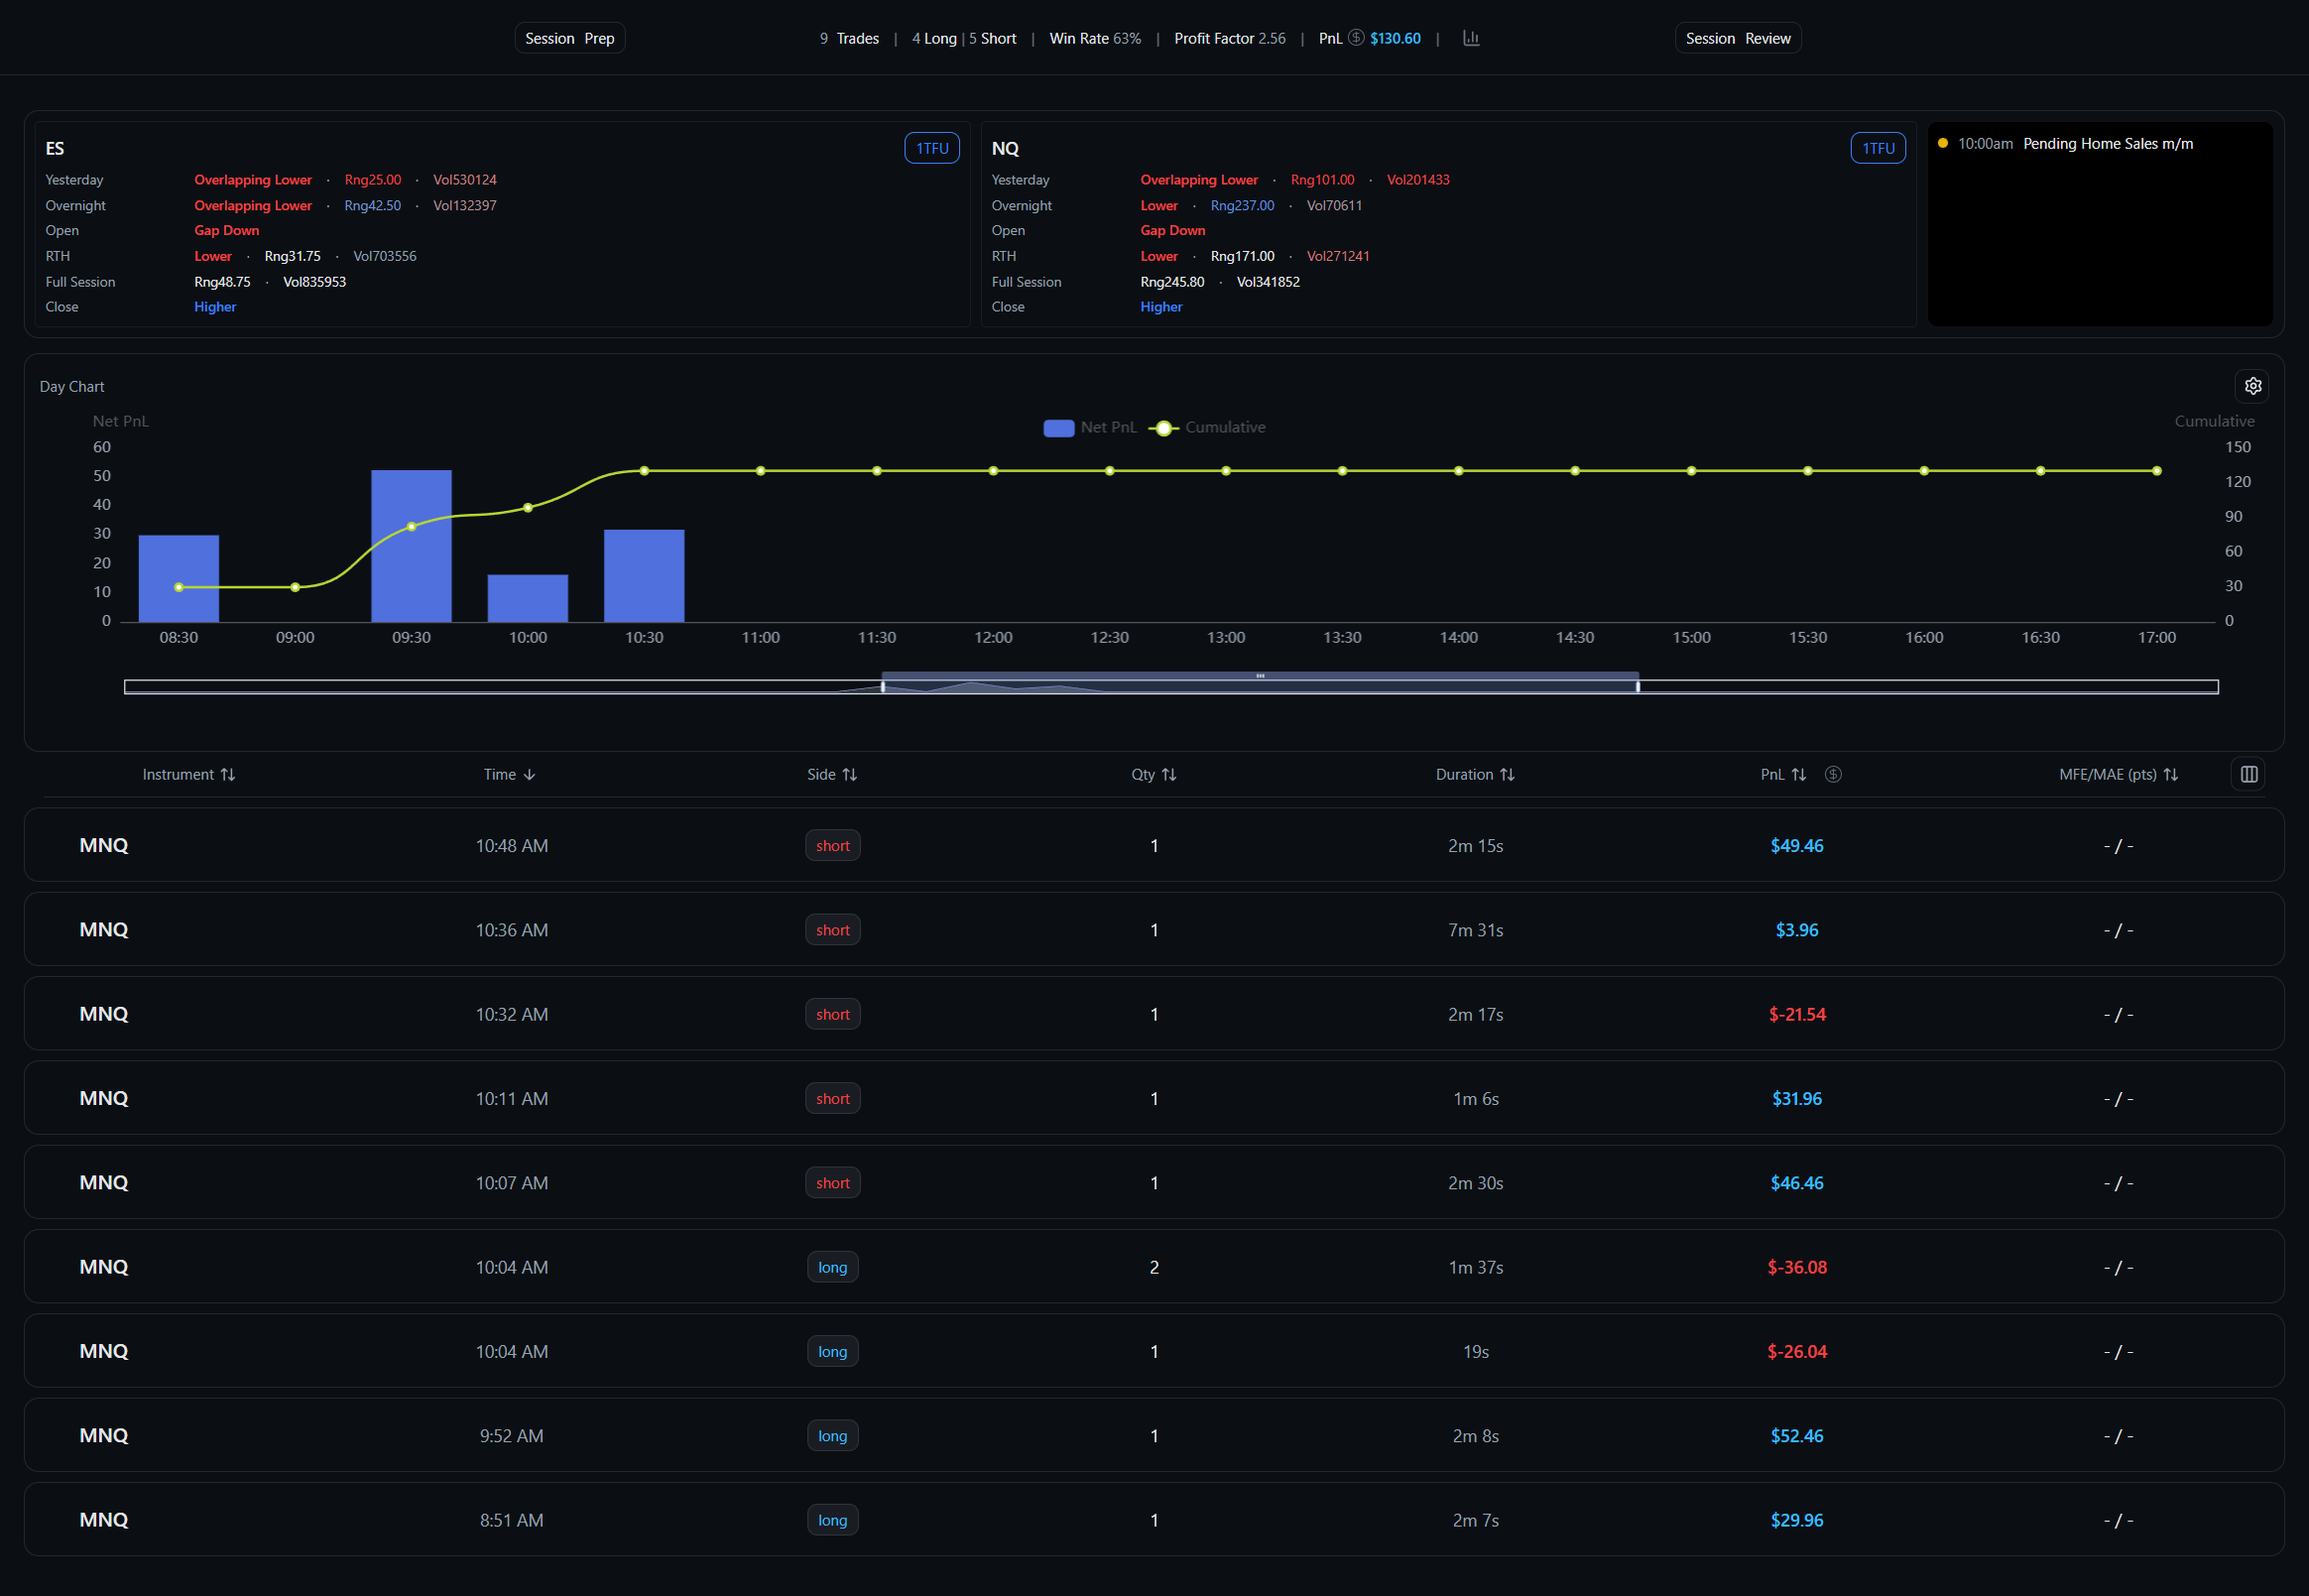 Your stats
 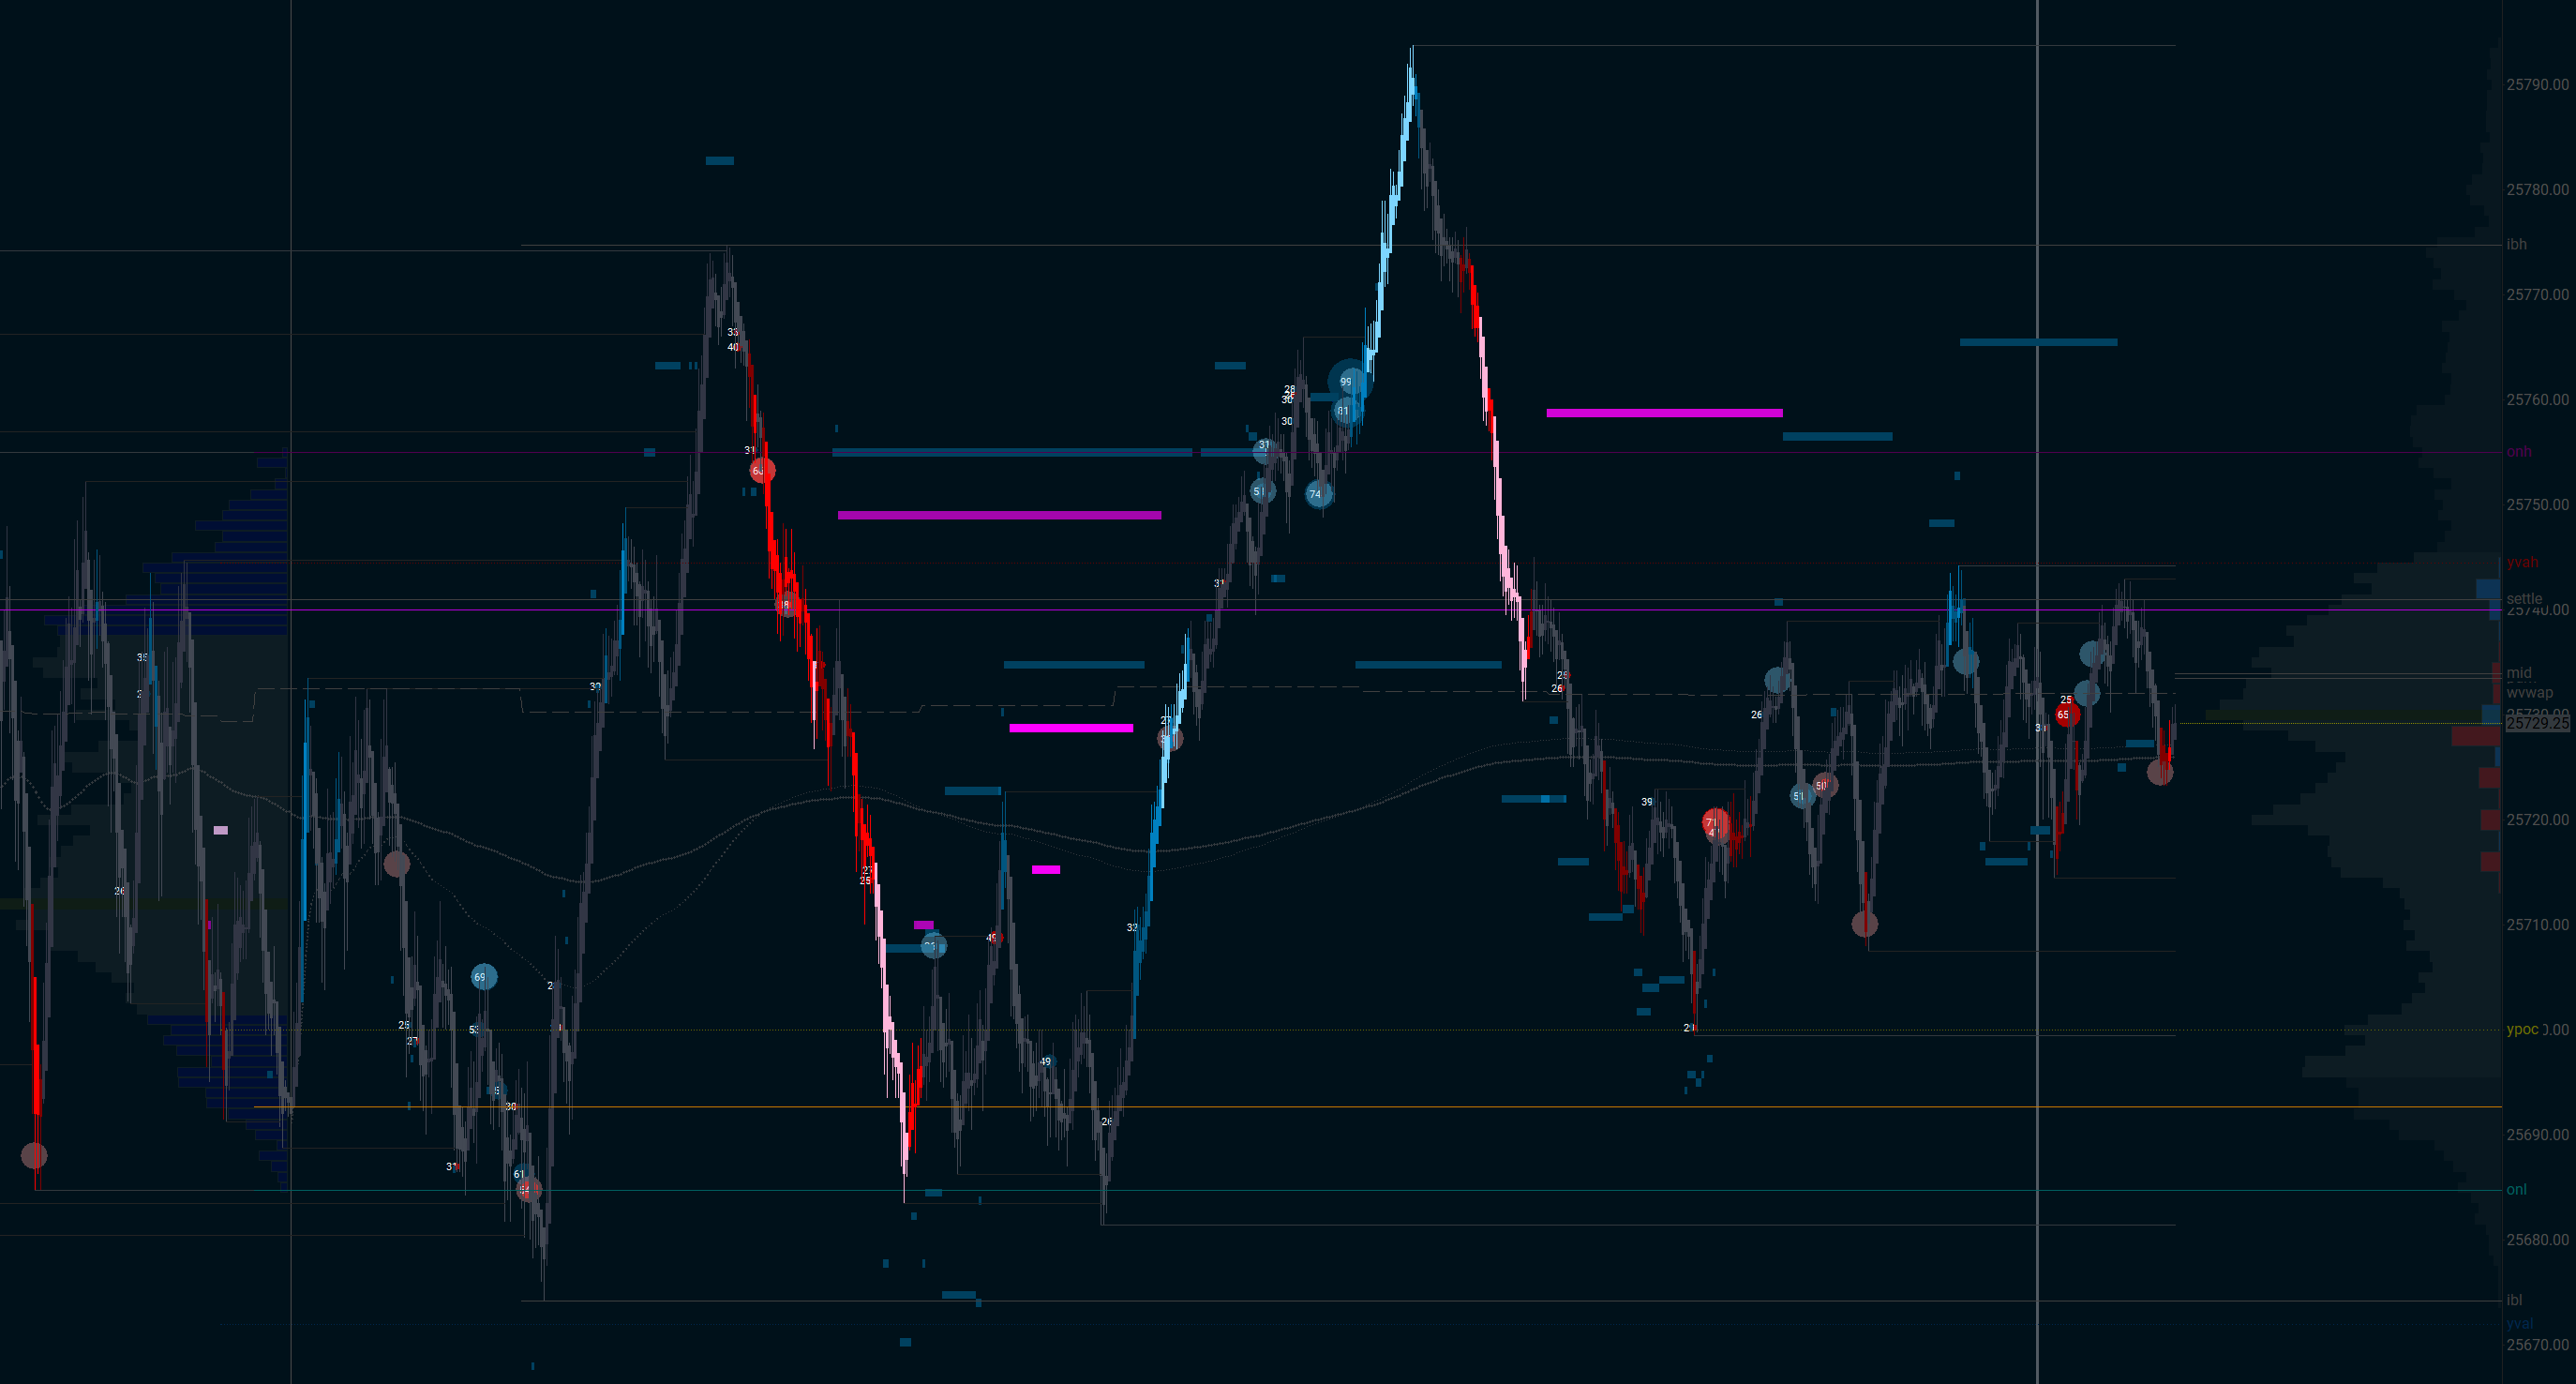 Your charts
 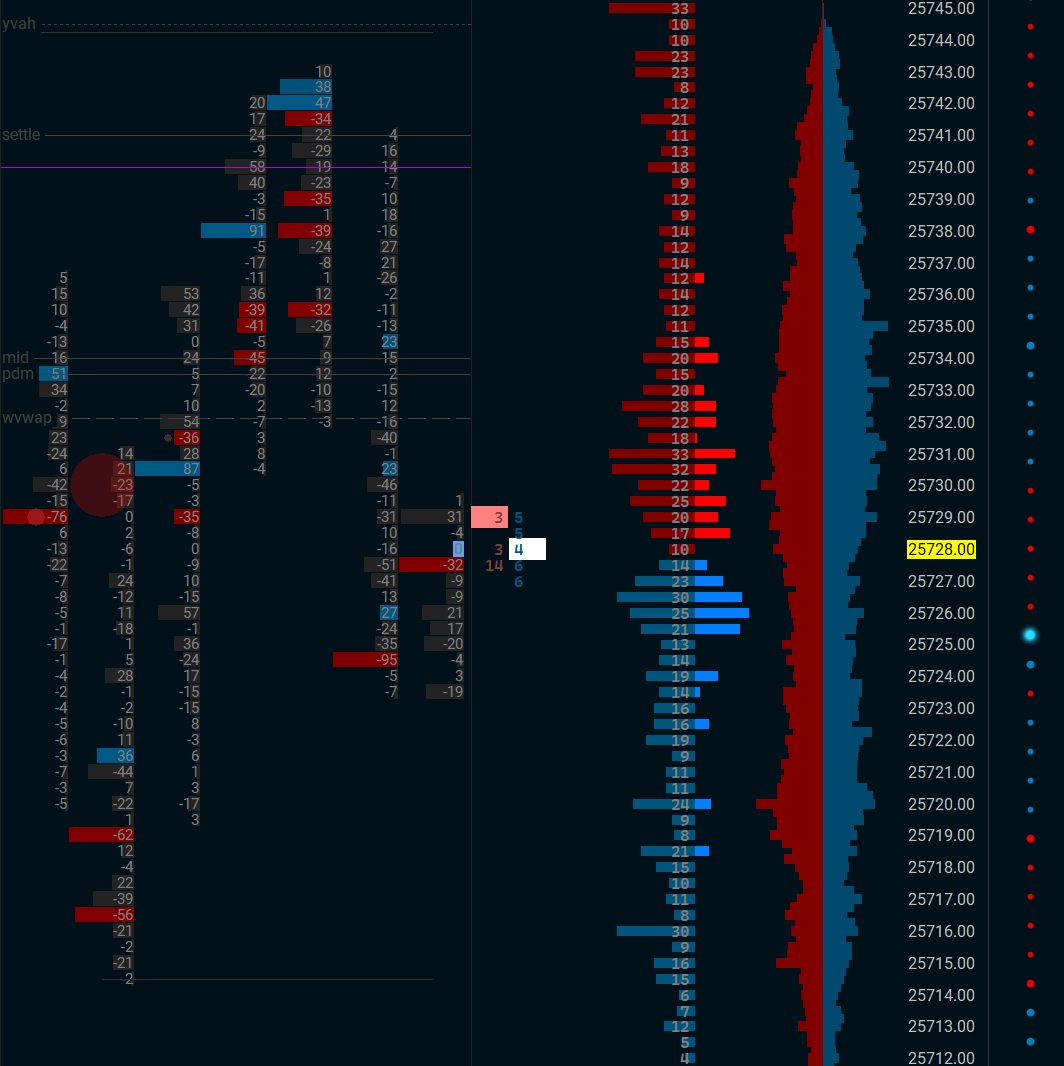 Your DOM
 See your charts. Mark them up. Evolve.
Generic bar charts don't tell the story. You need to see what you saw—your footprint, your DOM, your setup. FlowLogr captures it all at execution, so you can mark it up, spot patterns, and actually learn from every trade.
Built for orderflow & discretionary traders
Every feature designed around how you actually trade—not how SaaS products think you should.
Automatic Screenshots
Captured the instant you execute. See exactly what you saw when you pulled the trigger—no manual screenshotting required.
Stats That Matter
Win rate, expectancy, P&L curves, drawdown, time-of-day breakdowns. Filter by strategy, instrument, session, or any tag you create.
Quick Chart Markup
Arrows, rectangles, lines, text—draw right on your screenshots. Document setups in seconds, not minutes.
Session Prep & Review
Pre-session journals to set your game plan. Post-session reviews to capture lessons while they're fresh.
Market Calendar
Economic releases and market events at a glance. Know what's coming before you put on risk.
Tags & Organization
Tag trades by strategy, setup, mistake, or market condition. Then slice and dice your stats any way you want.
Sierra Chart Integration
Trades pulled straight from Sierra Chart's activity log. Zero manual entry. Connect once, then forget about it.
Stay in the Flow
No alt-tabbing. No breaking concentration. FlowLogr works silently in the background while you focus on trading.
100% Local
Your data never leaves your machine. No cloud, no subscription, no one else seeing your P&L. You own it all.
SC Study: MGI Levels
Auto-plot session highs/lows, value areas, and other market-generated levels. Included free with your license.
SC Study: Borderless T&S
Clean time & sales with dotstream mode. See the tape flow without the visual clutter. Also included free.
Retry Grouping
Group consecutive entries into retry clusters. See how your conviction plays out across multiple attempts.
How it works
Set it up once. Then just trade.
Connect Sierra Chart
Point FlowLogr at your Sierra Chart activity log. One-time setup—trades sync automatically from there.
Trade like normal
Focus on the market. FlowLogr runs silently in the background, capturing and linking screenshots to every trade.
Review & level up
After the session, review trades with full visual context. Mark them up, tag them, and build your edge over time.
100%
Your data, your machine
0
Manual screenshots needed
$0/mo
No subscriptions ever
Done with the screenshot shuffle?
Join the waitlist for early access. Be among the first to use a trading journal that actually captures what you see.
Join the WaitlistNo spam. We'll only email you when FlowLogr is ready.