Trading Journal for Sierra Chart
Stay in the flow. Your logging is handled.
FlowLogr captures your view the instant you execute—automatically, in the background, allowing you to stay focused on what matters in the moment.
Native. Fast. Local only.
Public beta coming Q1 2026.
 Your executions
 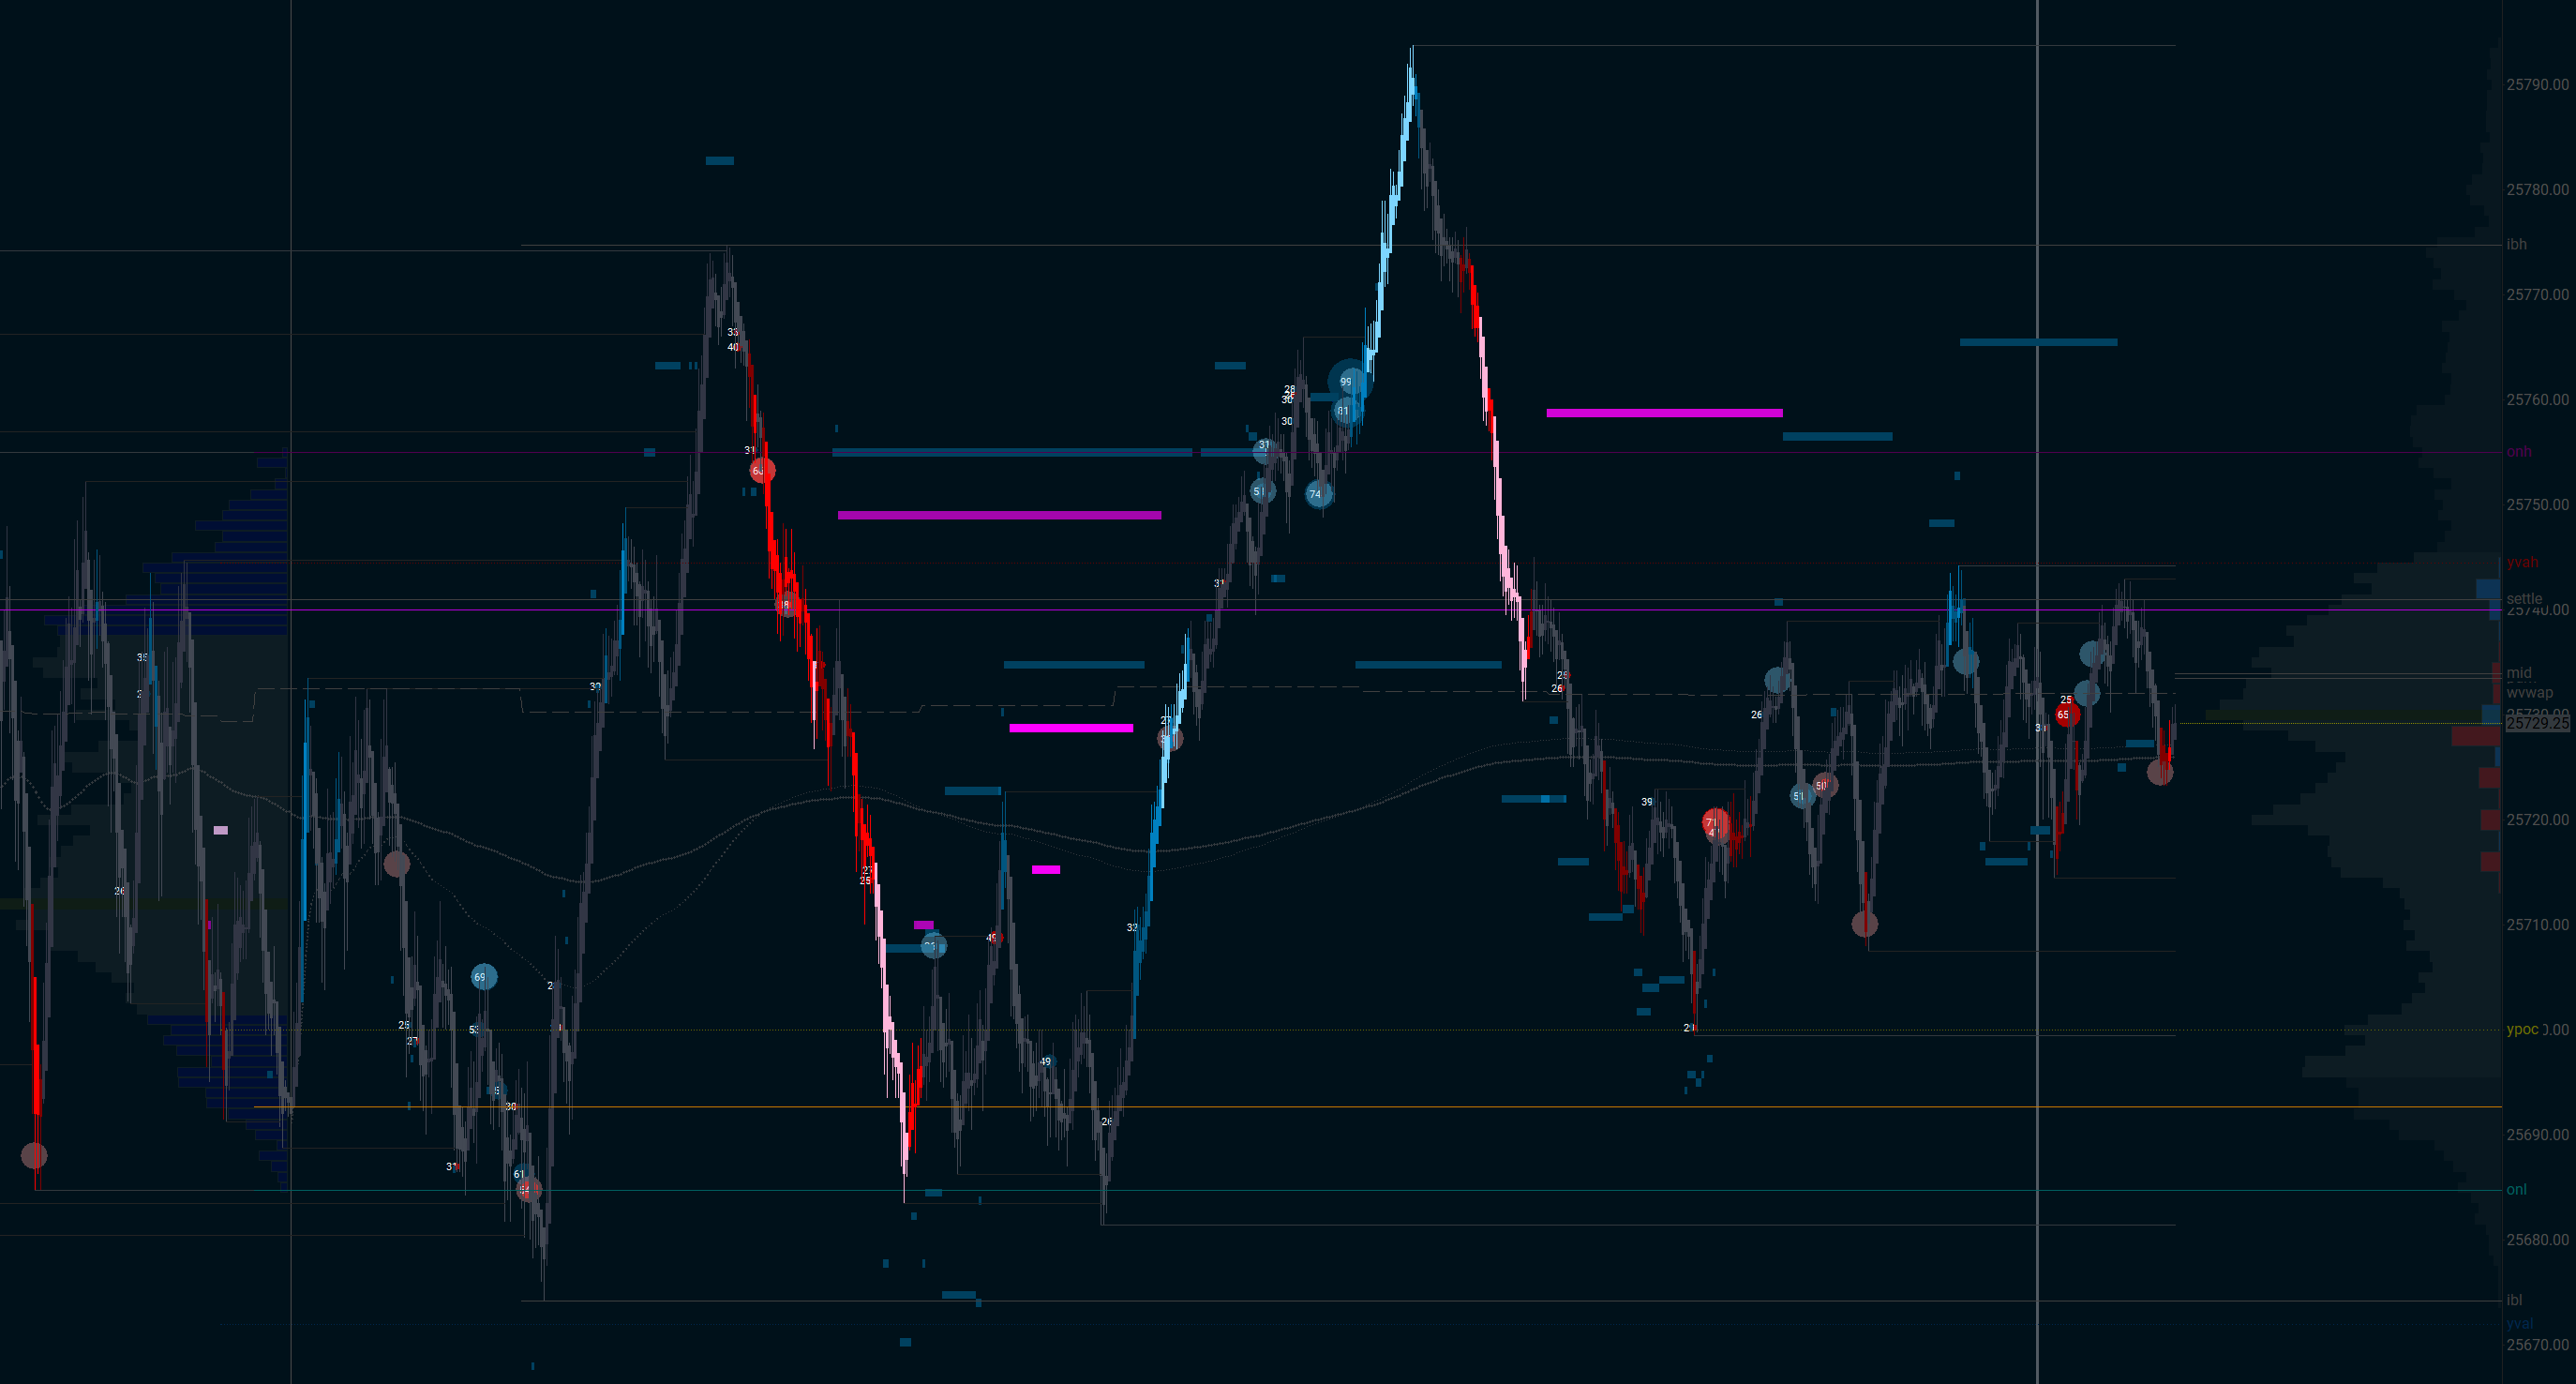 Your charts
 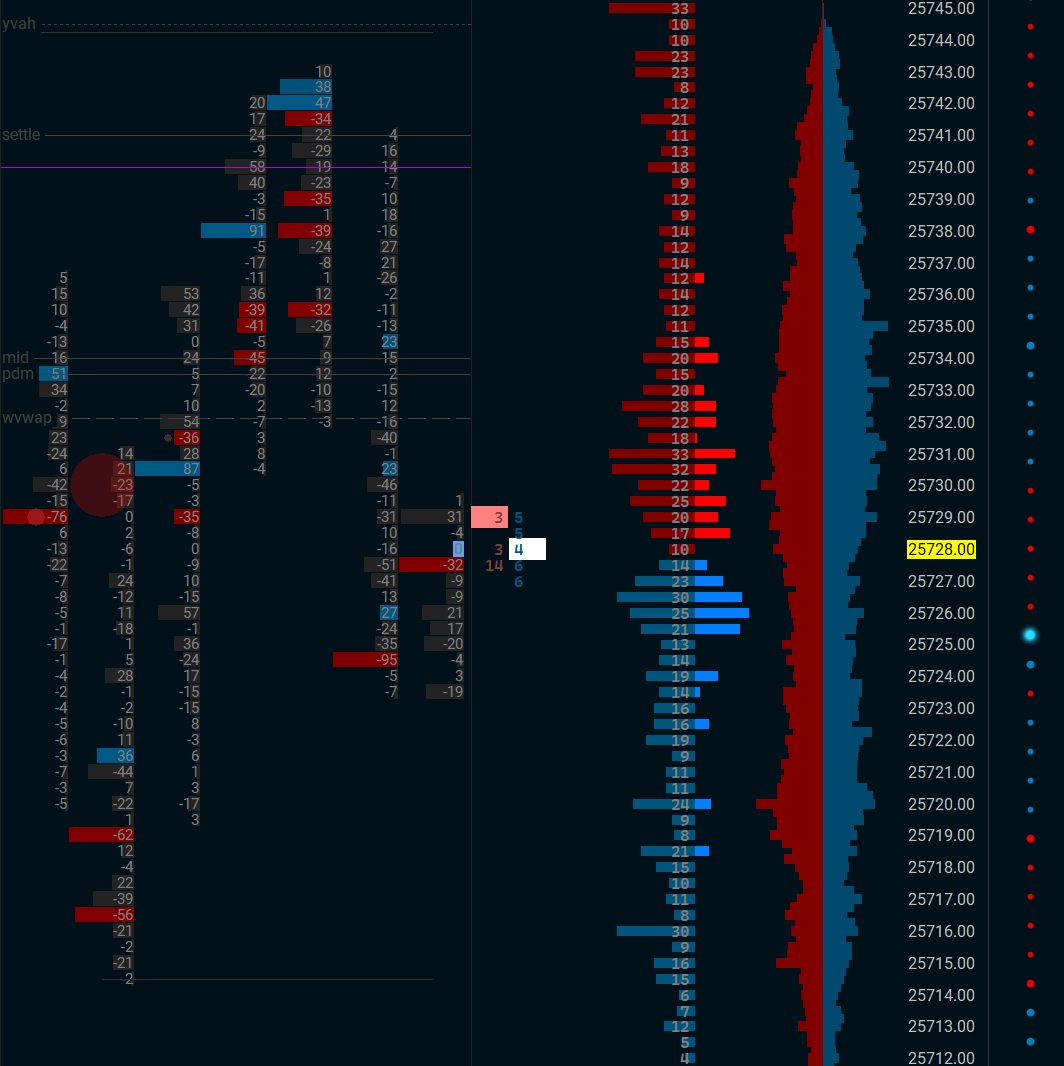 Your DOM
 See your charts. Mark them up. Refine your edge.
You worked hard to see the market your way. Reviewing someone else's charts doesn't help. When journaling, you need to see what you saw—your footprint, your DOM, your setup. FlowLogr captures it all at execution, so you can mark it up, spot patterns, and actually learn from every trade.
Built for discretionary & orderflow traders
Designed to stay out of the way while you refine your edge.
Automatic Screenshots
Captured the instant you execute. See exactly what you saw when you pulled the trigger—no manual screenshotting required.
Stay in the Flow
No alt-tabbing. No breaking concentration. FlowLogr works silently in the background while you focus on trading.
Quick Chart Markup
Arrows, rectangles, lines, text—draw right on your screenshots. Document setups in seconds, not minutes.
Session Prep & Review
Pre-session journals to set your game plan. Post-session reviews to capture lessons while they're fresh.
Market Calendar
Economic releases and market events at a glance. Know what's coming before you put on risk.
Tags & Organization
Tag trades by strategy, setup, mistake, or market condition. Then slice and dice your stats any way you want.
Sierra Chart Integration
Trades pulled straight from Sierra Chart's activity log. Zero manual entry. Connect once, then forget about it.
Stats That Matter
Win rate, expectancy, P&L curves, drawdown, time-of-day breakdowns. Filter by strategy, instrument, session, or any tag you create.
100% Local
Your data never leaves your machine. No cloud, no subscription, no one else seeing your P&L. You own it all.
SC Study: MGI Levels
Auto-plot session highs/lows, value areas, and other market-generated levels. Included free with your license.
SC Study: Borderless T&S
Clean time & sales with dotstream mode. See the tape flow without the visual clutter. Also included free.
Retry Grouping
Group consecutive entries into retry clusters. See how your conviction plays out across multiple attempts.
How it works
Set it up once. Then just trade.
Install
Download FlowLogr and install the included Sierra Chart study. Takes about two minutes.
Add the study
Drop the FlowLogr study onto your execution chart. That's the hook—it tells the app when you trade.
Trade
That's it. FlowLogr runs silently, capturing your charts and DOM every time you execute.
Review & level up
After the session, review your trades with full context. Mark them up, spot patterns, refine your edge.
A closer look
From big-picture monthly stats to granular trade details—everything you need to review and improve.

Month at a glance
See your entire month laid out—green days, red days, and everything in between. Quickly spot patterns in your trading rhythm and identify which days of the week work best for you.
- Color-coded P&L for each trading day
- Click any day to drill down into details
- Running totals and monthly summary

Weekly breakdown
Zoom into a single week to review your sessions day by day. Perfect for your weekend review routine—see what worked, what didn't, and plan adjustments for the week ahead.
- Daily P&L and trade counts
- Week-over-week comparison
- Ideal for weekend review sessions

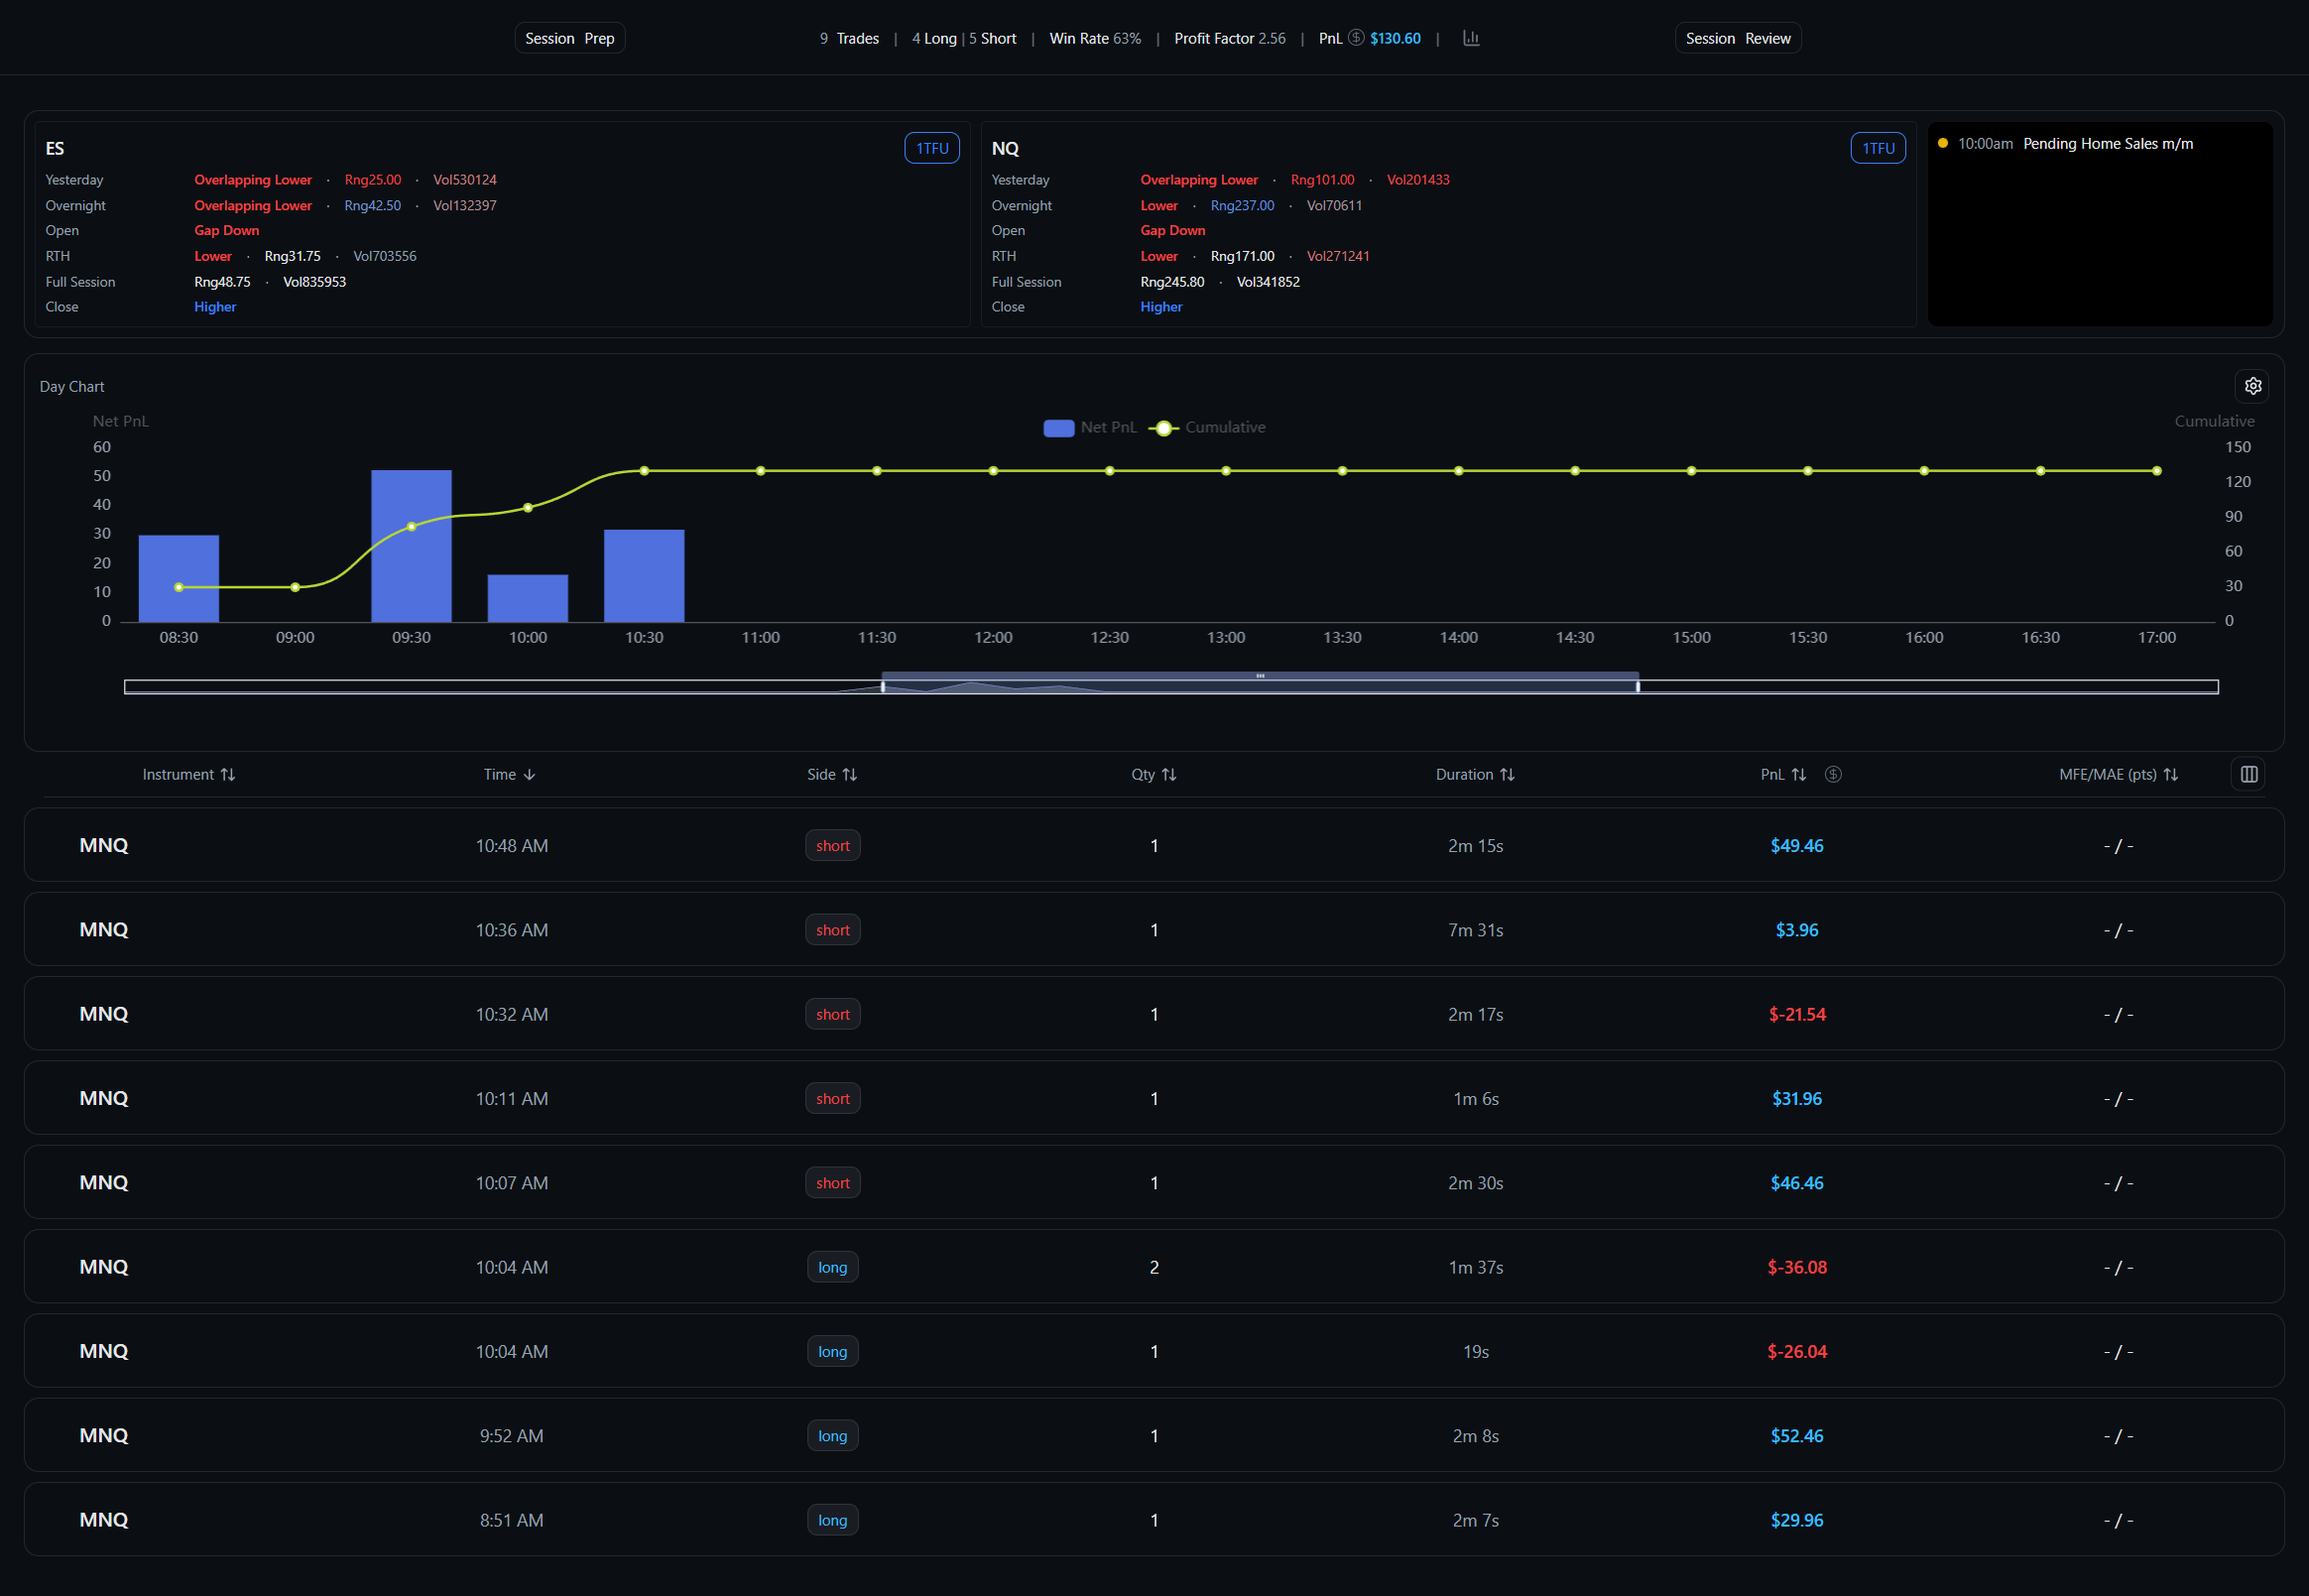
Daily session detail
Every trade from the session, laid out chronologically. See your executions, P&L progression, and jump directly to any trade for a deeper look. This is where your post-session review happens.
- Chronological trade list with P&L
- Session notes and pre/post journals
- Cumulative P&L curve for the day

Trade deep dive
Every trade gets its own page. See the screenshots captured at entry and exit, add notes, apply tags, and review the execution details. This is where you turn raw trades into lessons.
- Auto-captured entry and exit screenshots
- Trade notes and custom tags
- Execution details: fills, times, size

Mark up your charts
Draw directly on your captured screenshots. Highlight key levels, annotate your thought process, circle the signal that triggered your entry. Make your future self understand exactly what you were seeing.
- Arrows, lines, rectangles, and text
- Color-coded annotations
- Non-destructive editing—original preserved

Stats that tell the story
Win rate, expectancy, profit factor, average win vs. average loss—all the numbers you need to understand your edge. Filter by date range, instrument, strategy, or any tag to isolate what's working.
- Key performance metrics at a glance
- Filter by tag, instrument, or date range
- P&L curves and drawdown analysis
100%
Your data, your machine
0
Manual screenshots needed
$0/mo
No subscriptions ever
Done with the screenshot shuffle?
Join the waitlist for early access. Be among the first to use a trading journal that actually captures what you see.
Join the WaitlistNo spam. We'll only email you when FlowLogr is ready.